Last month I looked at how many Magento sites I could find in the Alexa top 1 million. So that I had a benchmark to compare against I also looked for osCommerce installations.
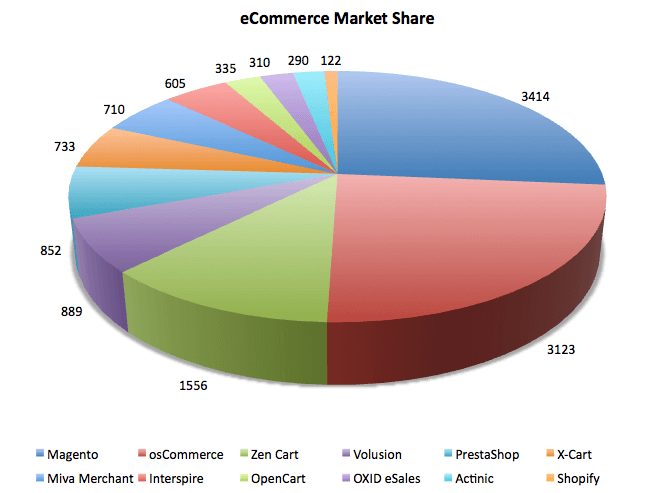
This month, I’ve expanded the signature set to cover a wider range of popular eCommerce software/packages. Magento still takes the top spot, this month with 3414 sites - 150 more than last month. 77 of these sites were found to be using Magento Enterprise edition. 2nd place still goes to osCommerce with 3123, a touch less than last month. Following the leaders, although a considerable amount behind, is Zen Cart and then Volusion with 1556 and 889 respectively.

Volusion is often talked about as an alternative to Magento, but I only found a quarter as many Volusion stores. Volusion definitely have their eyes on potential Magento customers. When I Google search for Magento, I see ads for Volusion and Shopify. When following the Volusion link it leads to a page comparing Volusion with Magento (I use the term loosely). Even though Shopify also advertises, I was only able to find 122 stores in the top 1 million this month.

Weighted Rankings
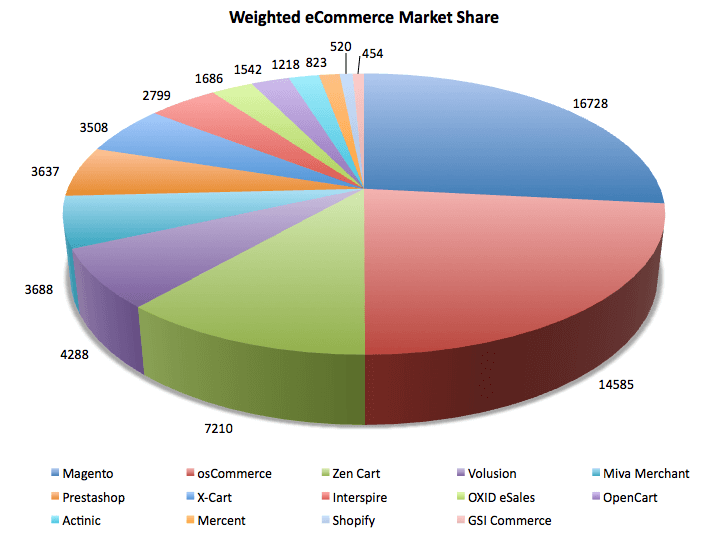
A limitation from the previous analysis was that a site that was in the top 100 was ‘worth’ the same as a site that was ranked 999,999th. Therefore, with the aim of being fairer to those sites that have earned the higher rank, I gave each site a weighting for the pie chart. I divided the 1 million ranks into 10 categories, each 100,000 wide. I then assigned 10 to the sites in the 1-100,000 category, 1 to the sites in the 900,000 to 1 million, and so on for the rest of the categories.
I then counted up the new ‘scores’ and produced an updated pie chart as you can see below. The largest eCommerce players are still there, i.e. Magento, osCommerce and Zencart but the lower players have moved around. All of these appear to be reasonably well distributed on average across the top million.

GSI Commerce performs interestingly. I only found 48 GSI Commerce stores, but from the weightings, it can be seen that most of these must be in the top 100,000 sites. Suggesting it’s a popular choice for the enterprise customer base. Indeed, sites include Toys R Us, NFLShop and Adidas.
Similarly, Mercent were relatively low in the table in terms of the number of sites detected. However, when the average rank category was looked at, it was found to be in the 100,000 to 200,000 segment. This would imply that the Mercent customer base is also skewed towards enterprise.
Results in Full
| eCommerce Package | Number of Sites | Weighted Number of Sites | Average Rank Category |
|---|---|---|---|
| Magento | 3414 | 16728 | 500,000 - 600,000 |
| osCommerce | 3123 | 14585 | 500,000 - 600,000 |
| Zen Cart | 1556 | 7210 | 500,000 - 600,000 |
| Volusion | 889 | 4288 | 500,000 - 600,000 |
| PrestaShop | 852 | 3637 | 500,000 - 600,000 |
| X-Cart | 733 | 3508 | 500,000 - 600,000 |
| Miva Merchant | 710 | 3688 | 400,000 - 500,000 |
| Interspire | 605 | 2799 | 500,000 - 600,000 |
| OpenCart | 335 | 1542 | 500,000 - 600,000 |
| OXID eSales | 310 | 1686 | 400,000 - 500,000 |
| Actinic | 290 | 1218 | 500,000 - 600,000 |
| Shopify | 122 | 520 | 500,000 - 600,000 |
| Mercent | 102 | 823 | 100,000 - 200,000 |
| ekmPowershop | 71 | 236 | 600,000 - 700,000 |
| nopCommerce | 52 | 242 | 500,000 - 600,000 |
| GSI Commerce | 48 | 454 | 1 - 100,000 |
| Big Cartel | 28 | 129 | 500,000 - 600,000 |
| TomatoCart | 11 | 39 | 600,000 - 700,000 |
| LemonStand | 4 | 16 | 600,000 - 700,000 |
With results like this, I know whom my money is on for favourite eCommerce application in the Packt Open Source Awards.
Methodology
There were a couple of questions posed to me last month about how I undertook this investigation. I’m not doing anything complicated for this. I don’t make any odd requests to sites to try and determine what they’re running by the response. I simply look at the index page and look for identifying features within the HTML. For example, I look at the JavaScript and CSS files that are used and the style of links.
Limitations
As detailed in my methodology, I’ll admit this is far from a comprehensive analysis, but I hope it’s a good indication of eCommerce stores in use.
When writing the signatures, I had to strike a balance so that I avoided false positives, but that I also detected as many eCommerce sites as possible. Another difficulty that I had during testing was that some stores had removed the identifying features of the particular software that I knew they were running. This is unavoidable but means that the numbers are not always as high as they should be.
Also, I’ve had to make the assumption that all stores are installed on the root of the domain or sub domain, which will not always be true for all eCommerce stores.
And Finally..
The software that I have looked at this month were mainly the eCommerce packages that first came to my head, but some were suggested to me. So if you have any particular ones that I’ve not included that you would be interested in me adding signatures for, share them in the comments or via twitter (@bobbyshaw).
I’ve undertaken some further analysis on the Magento sites, posts to follow in the coming weeks once I get time to write up my findings!